Thermodynamics:
In Denmark we have an ongoing discussion on klimadebat.dk whether Global Mean Temperature GMT is a valid proxy for global heat balance/ global warming. Professor in thermodynamics, Bjarne Andresen, explains that one cannot simply add temperatures and then divide them to get at mean temperature in a non equilibrium thermodynamic system.
Asymmetric Hemispheres
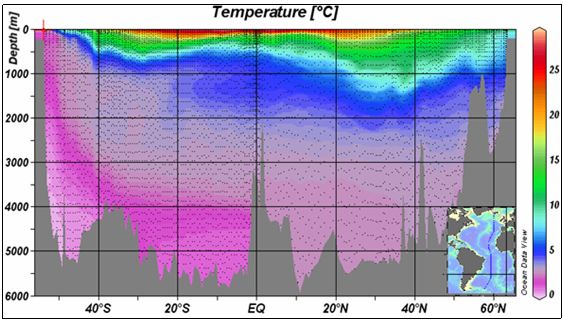
Fig 1.
Our planet is asymmetric. In the Northern Hemisphere 39% of the area is land.
In the Southern Hemisphere only 19% is land. This means twice as much continent on the NH as on the SH
Due to the heat capacity of the oceans and the huge amount of water moving vertically and horizontal oceans absorb almost 90% of all absorbed energy on Earth.
Antarctica makes the Southern Hemisphere very cold because of ice albedo , cold winds , and sea- and glacier ice cooling the air and surface of the ocean. The waste ocean area also results in a lot of cooling because of evaporation.
Whereas a reduction in ice albedo in the Northern Hemisphere when exposed to increasing temperatures makes the Northern Hemisphere more vulnerable to global warming.
This means you need a lot more energy to warm up the Southern Hemisphere by 1 degree Celsius than you need to warm up the Northern Hemisphere by 1 degree Celsius.
Maps showing actual warming and models of global warming illustrate how the Northern Hemisphere warms up much faster than the Southern Hemisphere and several degrees Celsius more if exposed to the same amount of increased infrared radiation.
Map illustrating temperatures at the end of this century caused by increased emission of greenhouse gasses.
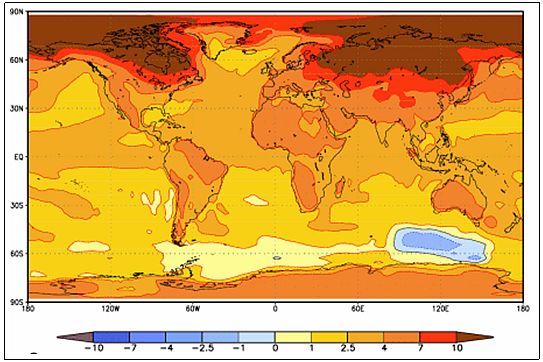
Fig 2.
Source: DMI Danish Meteorological Institute.
Map showing a more sensible Northern Hemispheric reaction to temperature change.
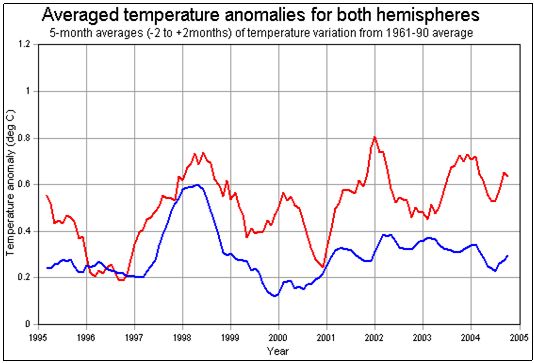
Fig 4.
Between 1910 -1940 most of the warming up took place in the Southern Hemisphere whilst most of the warming up during 1975-2005 took place in the Northern Hemisphere.
This means that globally more heat was needed to warm up the lower troposphere early in the century than later in the century. We are told by IPCC that warming up between 1910 -1940 is allegedly natural whilst warming up during 1975-2005 is said to be anthropogenic . This is very interesting. We are always told that the actual warming up is unprecedented.
To illustrate the case I will make a small calculation.
If the Northern Hemisphere warms up 1 degree and the southern atmosphere cools down 1 degree you have a temperature sum of zero. But actually you loose
energy, because it requires more energy to restore the energy in the south than you get from warming up the north.
Heat balance is a better proxy for global warming but it is very difficult to estimate.
On the other hand global mean temperature is so very biased that it has very little relevance when you wish to describe changes in global warming.
Birger Wedendahl,
Denmark
***************************************************************
– A few comments by Frank Lansner:
In the Atlantic Ocean we have a possibility to redistribute heat from South to North.
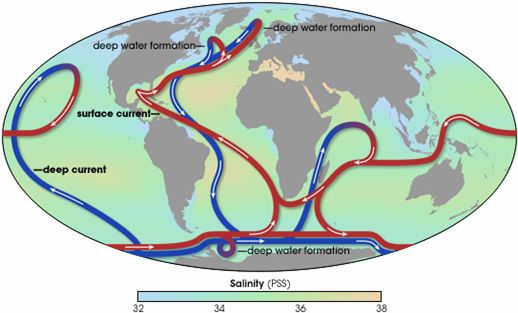
Fig 5.
As Birger Wedendahl mentions, there is much more land area on the Northern Hemisphere than on the Southern Hemisphere. Heat that is transported to the Northern Hemisphere is likely to spread out over the vast land areas. When measuring global temperatures as a simple mean of the surface area, then a simple redistribution of heat from South to North is then likely to appear as a global warming trend.
The AMO index that describes the heat of the Northern Atlantic appears oscillating, at least in the 20´ieth century:
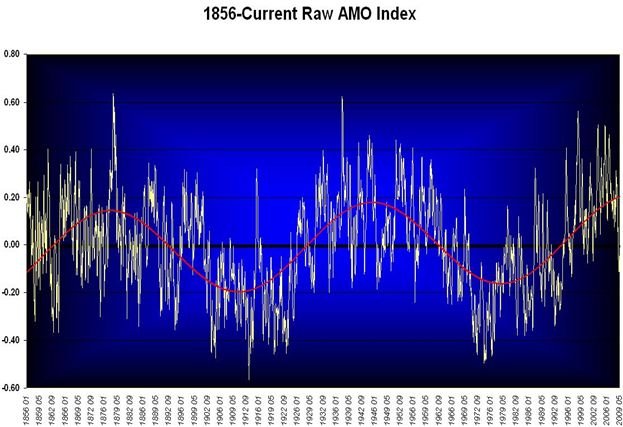
Fig 6.
According to the AMO, one might expect extra “global” warming around year 1940 and around year 2000.
So, the mix of land area and ocean area used for simple temperature mean for the globe might enable global temperature fluctuations simply by redistribution of heat.
An area more comparable to take a simple temperature mean would be the oceans only. (or land, however, Oceans obviously have more stable temperatures). So, perhaps Ocean temperatures are a more proper indicator of temperature trend of the earth:
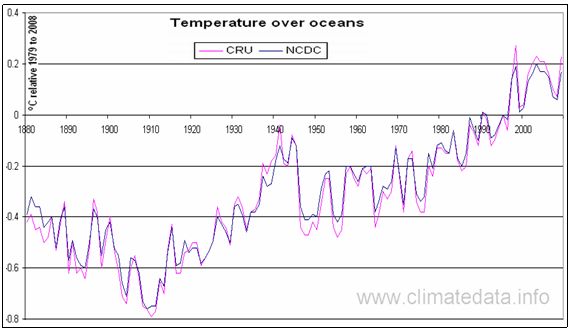
Fig 7.
Assuming the 70% of the planet – the Oceans – gives a better impression of the warming trend, it becomes obvious that the global warming 1940-2010 was only 0,25-0,3 K.
Further more, we see that the “global warming” was much faster 1910-40 than at any point after 1940…. !