In recent years the Swedish scientist from Stockholm University, Karlén, has tried to create attention to the fact the Scandinavian temperatures when represented by IPCC cannot be recognized in the real data from the Scandinavian temperature stations:
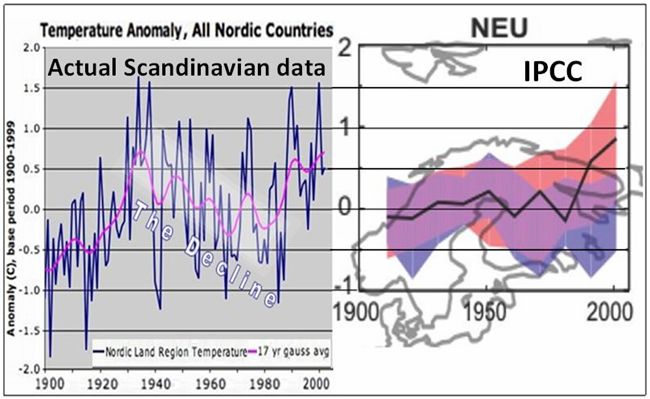
fig 1
Left: Karlen made a plot of 25 data series from the NordKlim database.
Right: IPCC´s temperature graph for the area does not reflect the actual Scandinavnian temperature graphs.
IPCC shows temperatures around year 2000 should be approximately 0,7 K higher than the peak around 1930-50, whereas the actual data collected by Karlen shows that year 2000 temperatures equals the 1930-50 peak, perhaps even lower.
http://wattsupwiththat.com/2009/11/29/when-results-go-bad/
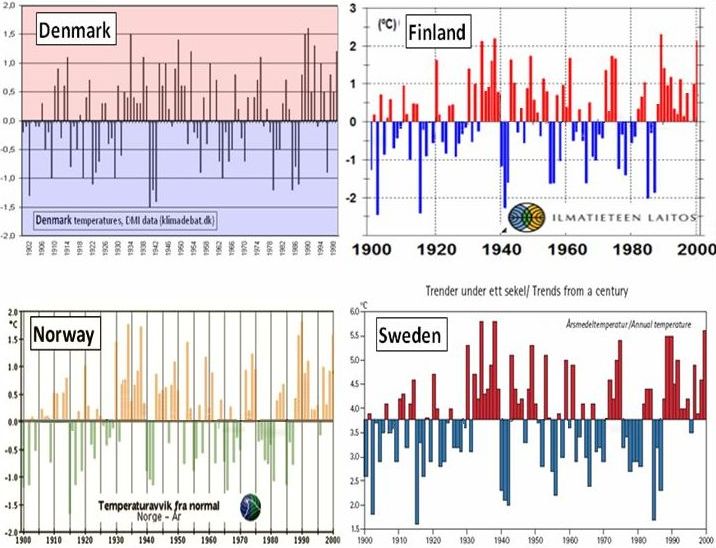
Was Karlen wrong? To evaluate this, lets check out the National meteorological institutes of the respective Scandinavian countries:
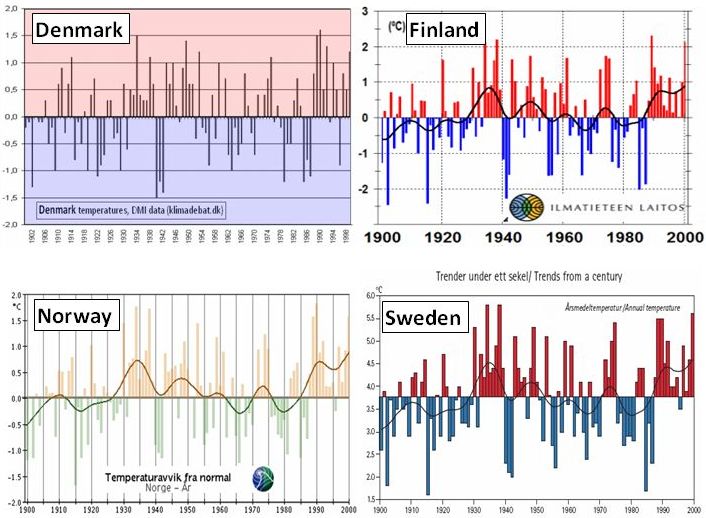
fig 2
Only Denmark shows slightly higher temperatures around year 2000 than in year 1930-50. 0,1 – 0,3 K warmer? However, the Danish Area around 3% of the overall area. For the vast majority of the Scandinavian area shows year 2000 temperatures just like the 1930-40 peak, Sweden maybe a tiny fall, Norway a tiny increase. Denmark is also the area of Scandinavia with far highest population density, and thus Denmark is likely to show more City heat effects (UHI) than the rest of Scandinavia.
So, With good confidence, we can say that Karlens data from Nordklim matches the opinions of the highest authority on Scandinavian temperatures. The very significant temperature peak around 1930-40 has been reduced almost removed totally. And here Scandinavian Islands that to some degree also represents Sea temperatures – and due to their lower populations are more free of any potential City heat (UHI). Here data fom SMHI:
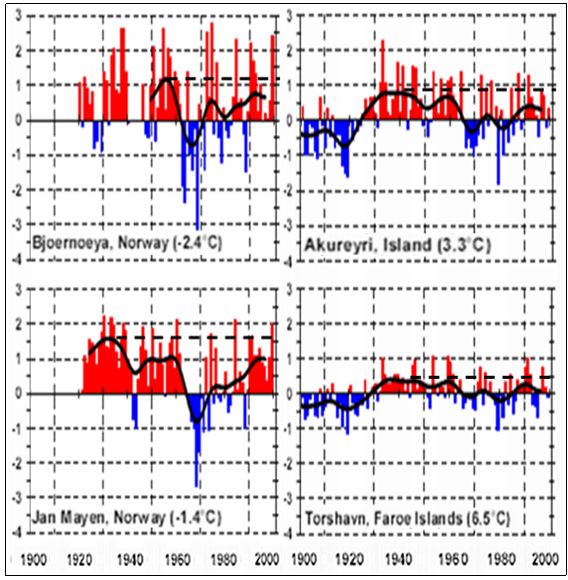
fig 3
Scandinavian Ocean temperatures indicated from Iceland, Jan Mayen and Faroe Islands actually shows a clear pattern of lower temperatures in year 2000 than in around 1930-40. In general we see: The further from population, the cooler temperature trends.
I found on the net temperature data from Kategat and the north sea (“Skagerak”). This ocean area is placed in the most populated area of Scandinavia, but still, no measurements where taken in cities, obviously:
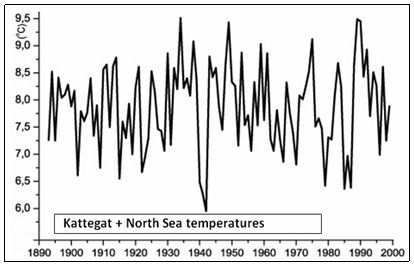
fig 4
Again, no IPCC-warming here either. (http://klimat.wordpress.com/2006/04/24/strandade-valar-pa-grund-av-varmare-vatten/)
For Finland I also found these data, which definitely shows colder year 2000 than 1940:
http://www.appinsys.com/GlobalWarming/RS_baltic_files/image012.gif
Here Scandinavian temperatures 1900 – 2000 cleaned from trend lines. Still no sign of global warming in Scandinavia.
The “NEU” area.
The “NEU” area is different from the Scandinavian area so to understand the IPCC warming trend over Scandinavia, we have to examine the “NEU” area.
The NEU area is defined as -10W/40E x 48N/75N:
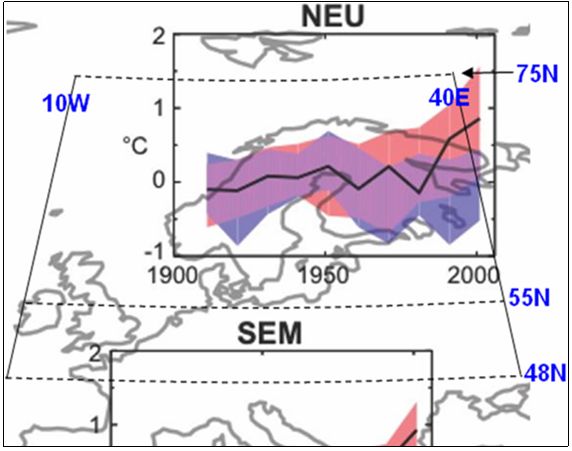
Fig 7.
The exact area of “NEU” is for some reason (?) not shown in the legend right under the figure 9.12 in the IPCC report AR4, but in an appendix later in AR4.
So the few IPCC AR4 readers that actually uses time to investigate the Scandinavian discrepancy will see that the actual area from the “NEU” for some reason does not stop around 55N, just between the NEU and the SEM graphic as would be expected. No, for some reason, IPCC has chosen to include areas far down in the “SEM” area on their graphic.
What is the consequence of expanding the NEU area further south than 55N? And why not stop at a round number 50N? Why 48N? Here are temperature trends for Hadrcrut 10W/40E:
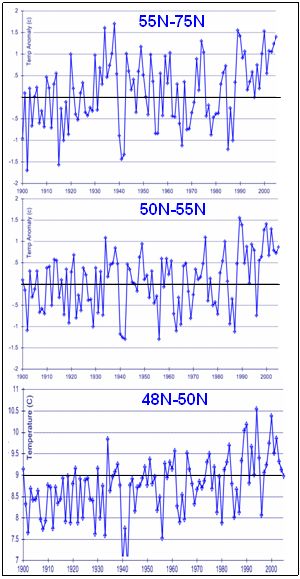
fig 8
The 2 upper graphs made using appinsys.com hadcrut gridded data 5×5, the lower by hadcrut stations 48N-50N. So, there is more and more heat trend the more southern areas we include in “NEU”.
Second, we see that ”NEU” on the IPCC graphic includes the big Norwegian Island, Spitsbergen, but when checking out, this “NEU” area does not at all include Spitsbergen for calculating temperatures. (There is no warming trend 1940-2000 for Spitsbergen.)
The last point of IPCC´s “NEU” graphic is year 2000. However, this point represents data 1999-2005. So, in my case especially Swedish national temperatures are hard to find on the net for later years than year 2000. SMHI does show long temperature trends for 2 larger cities only(!) that shows clear warming trend. They – unlike overall Swedish temperatures that shows no warming – are easy to find. Uppsala and Stockhom SMHI shows. For Finland, I found overall national temperatures AFTER 1950 on the official national meteorological site. The peak around 1940 was not shown – “hidden” perhaps. However for Finland its rather easy to find national temperatures on the net other places than their national meteorological site.
The averaging method:
The IPCC graph is hadcrut data (Brohan 2006), so how can IPCC show hadcrutdata so surpricingly rid of the decline after 1940? It appears impossible, as some readers suggest. This is due to the averaging method. IPCC used a rather different area than shown on their graphic for the (strongly corrected) hadcrut data. On top of this, the IPCC have chosen an averaging method of ten years collected in one point. And the peak around the middle of the 1930´ies has thus been diveded by separating in 1926-1935 and 1936-1945. The peak is thus almost gone.
Here is a normal 10 yr running mean curve for -10W/40E x 50N-75N:
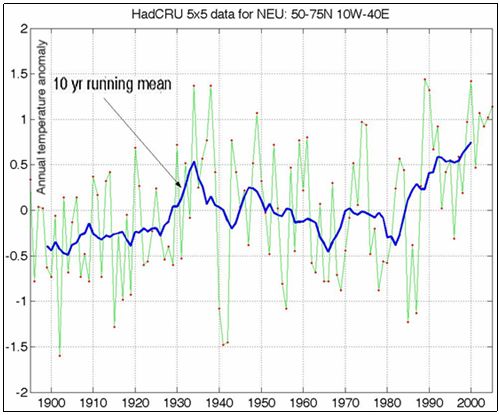
fig 9
And see the “magic” going on when dividing the 1930´ies peak into 2 10-year periods: It gone!
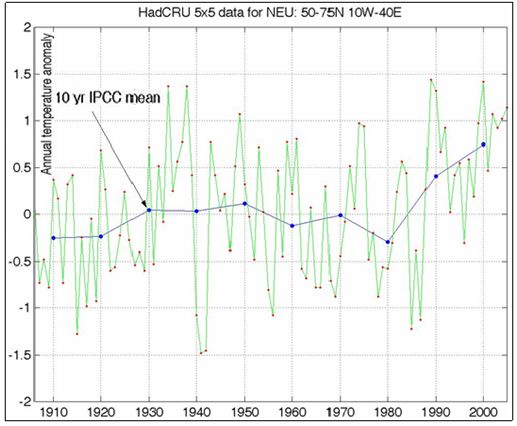
fig 10
The cold peak around 1942 seen in fig 8 is strongest in the 48N-50N band.
Where doe this bring us?
IPCC has put a warm-trend curve over a huge area of Scandinavia (that has no warming trend in original) because:
1) The NEU area does not include the full area incl Spitsbergen even though the graphic shows this.
2) The NEU area reaches down and uses warmer trends from the higher populated areas in the middle of Europe (down to paris, Wienna etc) – an area that according to their graphic should belong to their “SEM” data and not “NEU” data.
3) Their averaging method splits up the 1930´ies warm peak so we cannot see that it was just as warm around 1935-40 as it is today. Obviously, for the whole debate of global warming such an information is relevant and should appear to the reader.
Summa: IPCC does not show directly what “NEU” is by placing this information in a distant appendix. In reality, all readers that does not use hours to investigate this will get an impression of a warming Scandinavia and this is indeed misleading.
So without “doing anything wrong” IPCC misleads perhaps 99% of the readers?
Articles by Frank on WATTS UP WITH THAT:
http://wattsupwiththat.com/2009/01/30/co2-temperatures-and-ice-ages/
http://wattsupwiththat.com/2009/04/11/making-holocene-spaghetti-sauce-by-proxy/
http://wattsupwiththat.com/2008/12/17/the-co2-temperature-link/